Windermere Chief Economist Matthew Gardner revisits his Top 10 Predictions for 2023. Reviewing his forecasts for home prices, mortgage rates, and more, he highlights recent changes in the real estate market and updates his predictions for the near future.
This video is the latest in our Monday with Matthew series with Windermere Chief Economist Matthew Gardner. Each month, he analyzes the most up-to-date U.S. housing data to keep you well-informed about what’s going on in the real estate market.
Top 10 Real Estate Market Predictions 2023 | Mid-Year Update
Hello there, I’m Windermere Real Estate’s Chief Economist Matthew Gardner and welcome to this month’s episode of Monday with Matthew. You may remember that at the end of last year, I published my Top-10 Predictions for 2023 and, as we hit the mid-year mark, some of you have been asking me how well my forecasts have been holding up. So, I thought it would be interesting to take another look at them to see how accurate they have or have not been! These were the predictions I made last November, and they covered everything from my expectations for home sales and prices to shifting government policies.
U.S. Home Sale Prices

My first forecast suggested that sale prices would fall in 2023; however, I was not expecting any sort of systemic decline in values. Here you can see that year-over-year prices are down by a bit less than 2%, but when you look at how prices have changed month over month, they rose by 3.6% in April and are up by more than 6% since the end of last year.
I stand by my forecast that the median sale price in 2023 will be modestly lower than the 2022 number; and the monthly increase in sale prices that we have seen so far this year also supports my forecast that we are not seeing any long-term decline in home values.
2023 Mortgage Rates

Although mortgage rates have broken above 7% eight times so far this year—the first time because of the banking crisis, and the second because of the looming debt ceiling—I expect them to become a little less frantic as we move through the second half of the year. That said, my call for them to drop below 6% this year is now likely to be inaccurate given where they are today. I still expect them to drop into the “fives” though, but not until early next year.
Is housing inventory increasing?

Listing activity saw a very modest late spring bump, but for perspective, the number of homes for sale is running at about 40% of its long-term average, and I still don’t see much growth this year. Why? Well, by my calculations, there could be over 20 million homeowners with mortgage rates around 3%. Why would they move!
Is 2023 a buyer’s or seller’s market?

And with limited inventory, the market still “technically” favors home sellers. Now, this is a little speculative because what defines a traditional “buyer’s” or “seller’s” market varies by location, but with relatively few homes on the market and the share of homes with price reductions dropping and list prices rising again, I just can’t see a buyer’s market appearing this year.
Are home prices falling?

Well, this doesn’t look to be meeting my forecasts, does it! Sellers have been pretty bullish so far this year, but I would add that this is not true across the whole country. List prices are still down significantly in markets such as Hailey, Idaho; Jasper, Alabama; and Elko, Nevada, where list prices for single-family homes are down between 30 and 50% from their peak. So, I admit that the country has outperformed my forecast for list prices.
Return to Office Statistics 2023
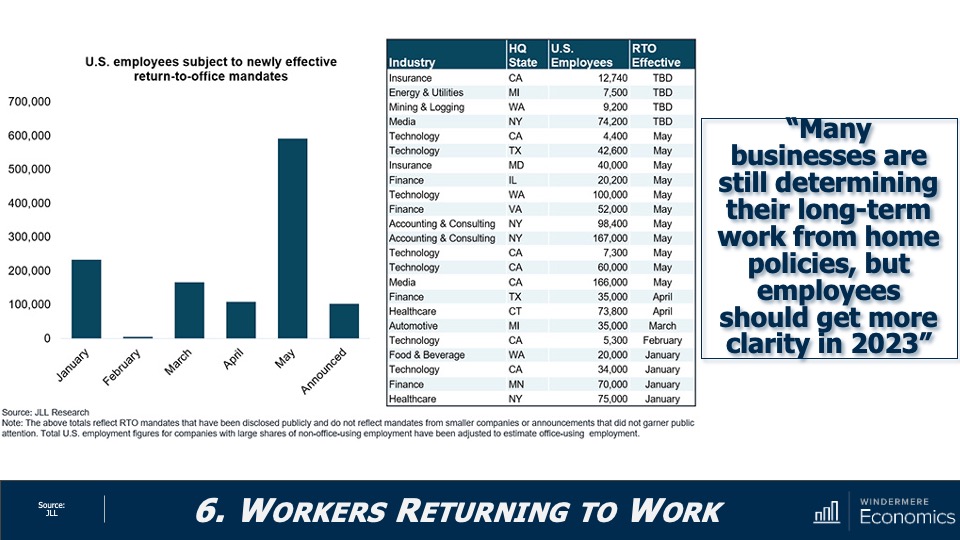
As I had expected, the pace of workers heading back to the office has not been very robust. In fact, the share of people in the office full time dropped to 42% in the second quarter of 2023, down from 49% in the first quarter, that according to The Flex Report. Meanwhile, the share of offices with hybrid work arrangements hit 30% in the quarter, up from 20% the previous quarter. But I still expect to see more workers heading back to their offices, albeit very reluctantly.
New Home Permits and Starts Have Fallen
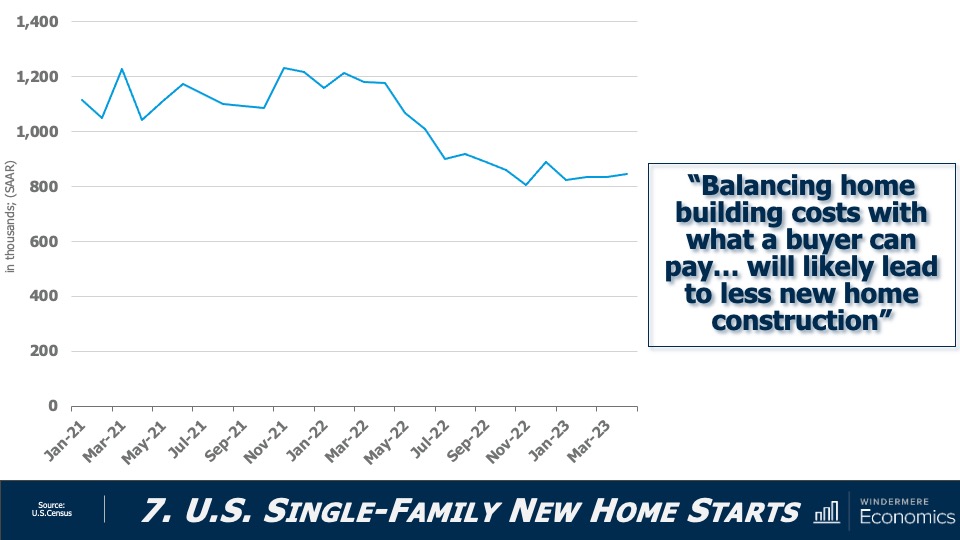
With new home permits down 21% year-over-year, and new home starts off by 28%, I think its accurate to say that activity in the new construction sector has slowed. Builders continue to be hit by high financing rates as well as high material prices.
Are U.S. home prices dropping?
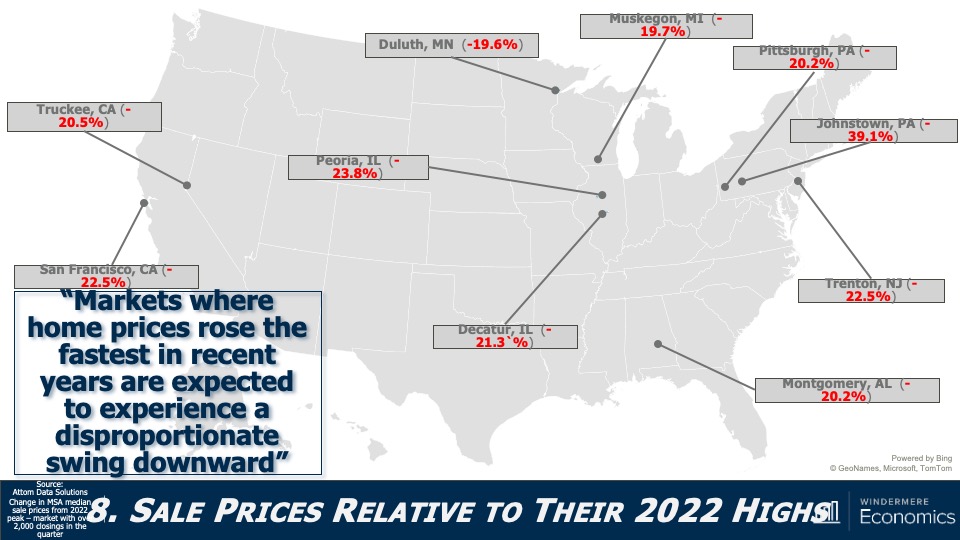
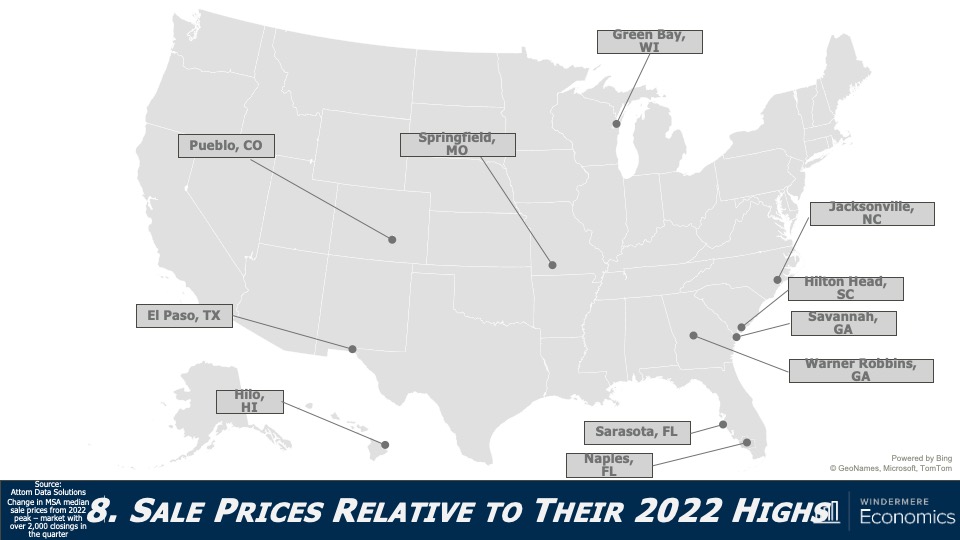
As we all know, not all markets are created equal, and this chart shows how far below their 2022 highs some of the country’s metro areas are. On the opposite end of the spectrum, there are some markets where prices have already exceeded the highs seen last year (see map below).
Housing Affordability 2023
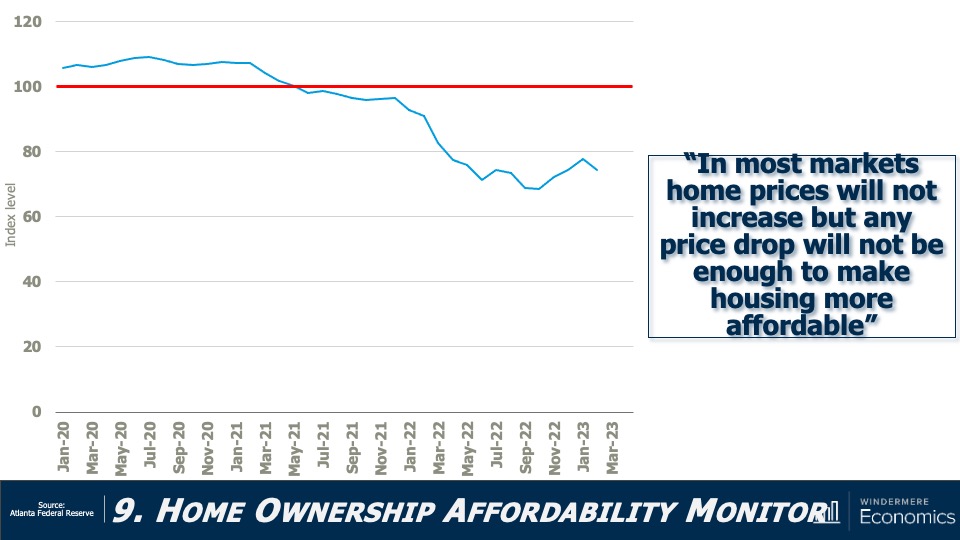
Affordability has not improved, mainly due to home prices that remain out of sync with incomes as well as financing costs that remain well above the level that buyers had become used to. I still believe that this will not improve in 2023.
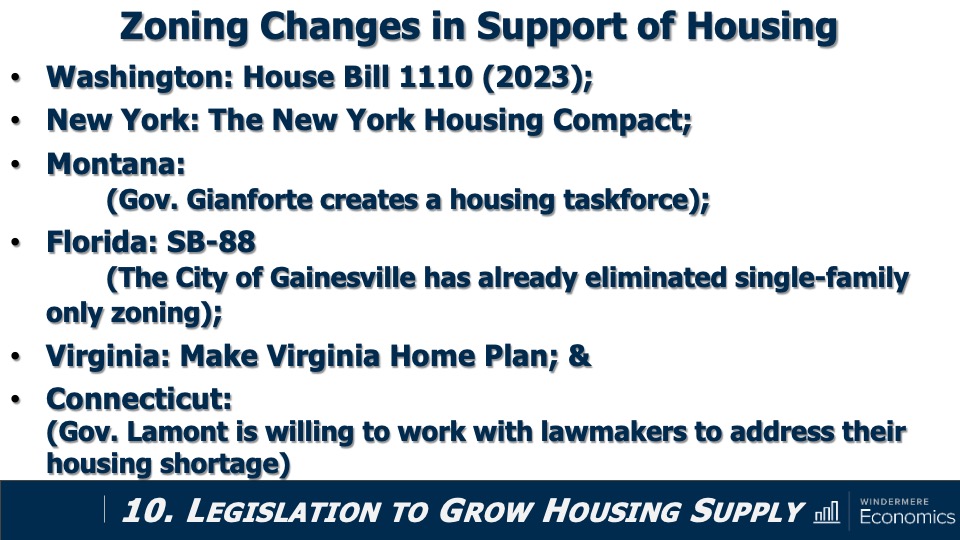
And finally, I told you that governments would start to move to address the significant housing shortage that the country is experiencing, and they have. As you can see, in Washington State, Governor Inslee recently signed House Bill 1110 into law which allows the development of duplex up to six-unit buildings within any area zoned for single-family-only development. Additionally, jurisdictions in a significant number of states are either pursuing legislation to tackle this problem or have at least created task forces to look at the issue. It’s a good start, but more needs to be done.
Although it’s really cheating to grade one’s own work, I think that I have been pretty accurate with my forecasts. Yes, I was too pessimistic when it came to list prices and a little optimistic regarding the direction of mortgage rates. But other than those two items, the data seems to suggest that the housing market is headed in the direction that I had suggested.
What do you think? I’d love to hear your thoughts on this subject so leave your comments below. As always, stay safe out there and I’ll see you all next month. Bye now.
To see the latest real estate market data for your area, visit our quarterly Market Updates page.
About Matthew Gardner
As Chief Economist for Windermere Real Estate, Matthew Gardner is responsible for analyzing and interpreting economic data and its impact on the real estate market on both a local and national level. Matthew has over 30 years of professional experience both in the U.S. and U.K.
In addition to his day-to-day responsibilities, Matthew sits on the Washington State Governors Council of Economic Advisors; chairs the Board of Trustees at the Washington Center for Real Estate Research at the University of Washington; and is an Advisory Board Member at the Runstad Center for Real Estate Studies at the University of Washington where he also lectures in real estate economics.

 Facebook
 X
X
 Pinterest
 Copy Link

